Welcome to The Pulse! Here we are going to break down and decode the labor market. Whether you are a senior employee eyeing late-stage career changes or a new graduate wondering what to expect in your job hunt, this will be your guide to the employment landscape.
Together, we’ll dive into the labor market and generate insights to help you navigate career decisions. The hunt for talent and skills is fierce, and those who navigate is wisely will find more opportunities, higher pay, and better job fits.
Our data source is the JOLTS report from the US Bureau of Labor Statistics. We will break it down into 3 categories to create actionable insights for you:
- Labor Demand – how strongly are employers seeking to hire? A strong demand makes it easier to find and be placed in jobs.
- Worker Confidence – how confident are workers in finding work? We’ll look at quit rates and layoffs rates to gauge how confident workers are or should be in finding new work.
- Labor Market – are we operating in a tight labor market? We’ll investigate unemployment and compare to job openings to draw conclusions about the overall job market.
Labor Demand
- Employment
- 10 year avg: +.2%, min 0%, max .6%
- 1 year avg: +.2%, min .1%, max .2%
- Current month = +175, +0.1%
*avg monthly change: avg +.01%, min: -0.6%, max: +0.6%
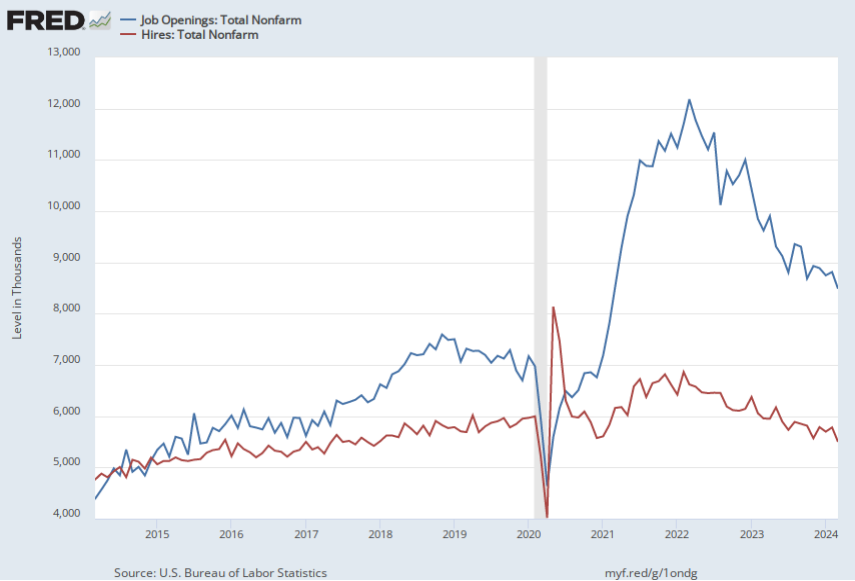
- Job Openings
- 10 year avg: +.07% , min -12.3%, max +15.4%
- 1 year avg: -1.1%, min -6.7%, max 6.3%
- Current month: – 325, -3.7%
*avg monthly difference: avg +0.3%, min: -13.0%, max: 17.7%
- Hires
- 10 year avg: +0.2%, min -5.8%, max +9.3%
- 1 year avg: -0.7%, min -4.9%, max +3.9%
- Current month: -281, -4.9%
*avg monthly difference: avg +0.1%, min: -9.8%, max: 11.3%
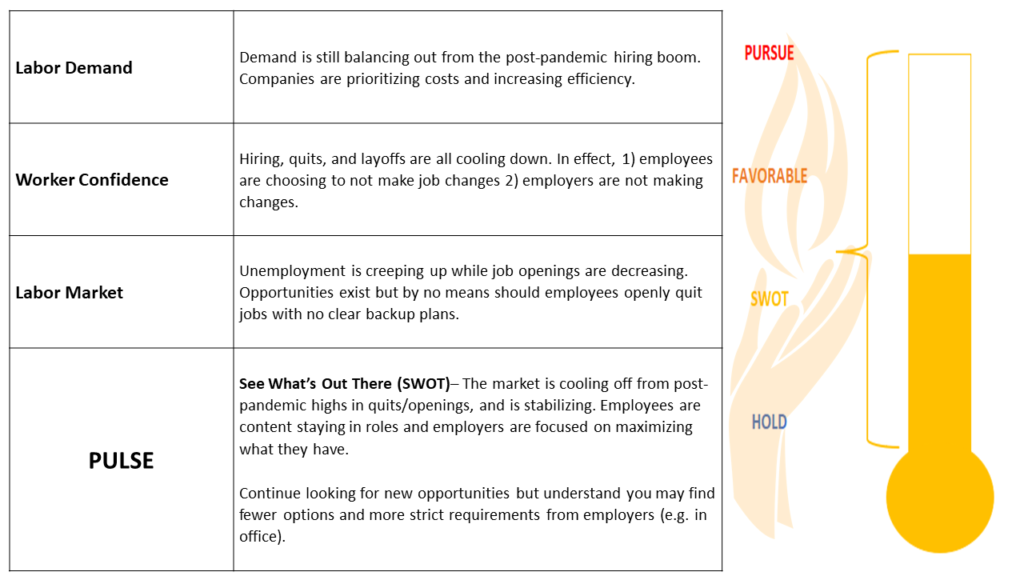
SUMMARY: Employment is increasing, albeit at a slower pace than the 10 or 1 year average. The main story here is normalizing. The post-pandemic hiring spree & job postings has more than tapered off and is returning to historical averages. Currently, the average rates of openings and hires have the steepest declines since the financial crisis (but are still returning to what historically normal).

Worker Confidence
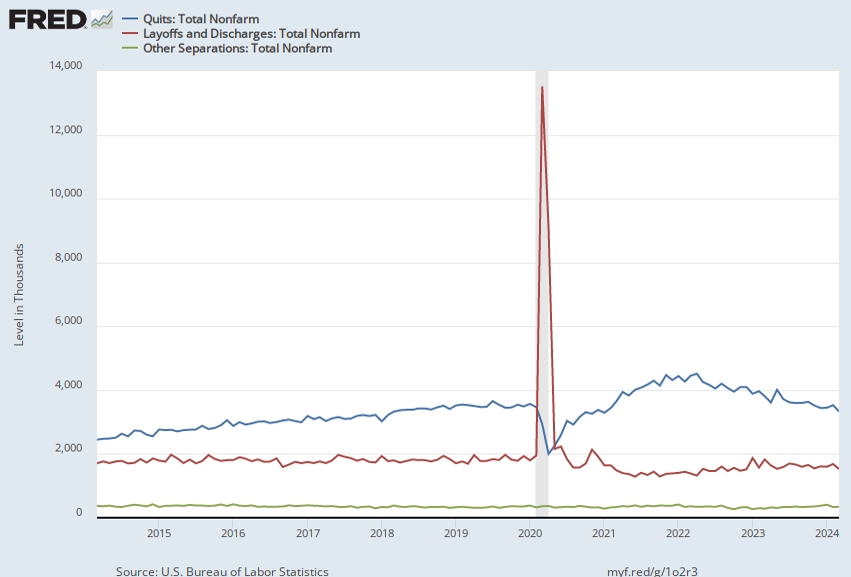
- Quits
- 10 year avg: +0.4%, min -7.3%, max +11.0%
- 1 year avg: -1.2%, -7.3%, +11.0%
- Current month = -198, -5.6%
*avg monthly change: avg +0.1%, min: -10.7%, max: +12.6%
- Layoffs
- 10 year avg: +0.1%, min -15.9%, +23.5%
- 1 year avg: 0.0%, min -10.4%, max 16.2%
- Current month: -155, -9.2%
*avg monthly difference: +0.1%, min: -16.4%, max: +23.5%
SUMMARY: Quits have been decreasing since the post-pandemic high and appear to be resetting closer to historical averages, . The number of layoffs continues to decrease, suggesting employers are shedding work as much as they are focused now on maximizing what they have.

Labor Market
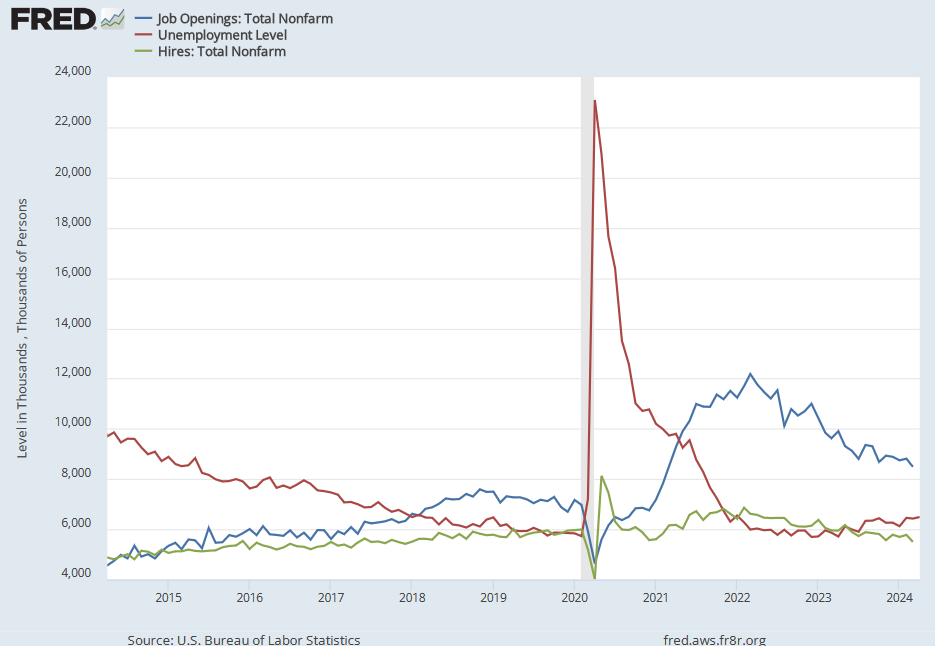
- Unemployment
- 10 year avg: -0.9%, min -8.1%, +7.4%
- 1 year avg: +0.8%, min -2.8%, max 7.4%
- Current month = +63, +1.0%
*avg monthly change: -.1%, min -8.1%, max +9.9%
SUMMARY: What we look for here is when job openings go up, unemployment goes down. The twist is job openings & hiring skyrocketed during the pandemic & immediately post-pandemic. While job openings are going down and unemployment is rising, there is still way more job openings than unemployment. But the final twist is hiring is also declining. We are living in a market where job opportunities exist, but employers are containing costs.

THE PULSE

